Predict future time series
I create a time series of the sum of sales with order date. Using the continuous lines visualisation and answering the following questions:
- With the time series illustrated using an annual frequency, is there any visible trend?
- Changing the frequency to quarterly, are any cycles or seasonality observed?
- Continue with the time series using a quarterly frequency, navigate to the “Analytics” tab and perform a forecast. Also, add a linear trend line to the time series. Insert the visualisation into this document and comment on the trend (or regression) line’s R-squared and p-value, as well as the forecasted sum of sales for the next year compared to the previous year.
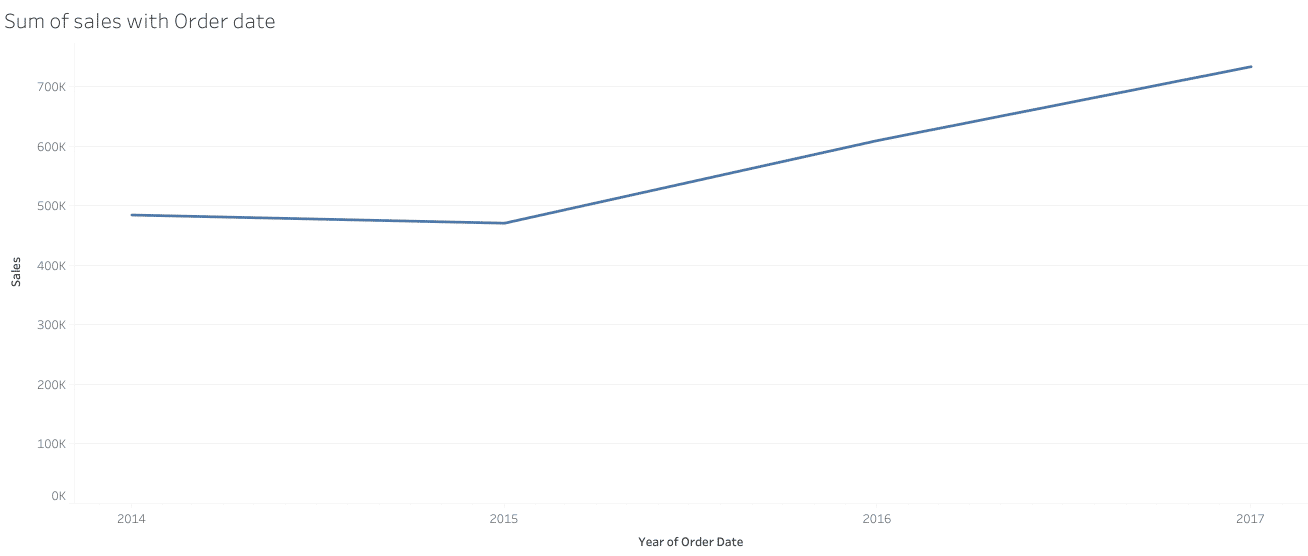
With the above time series between sales and order date on an annual basis, it can be easily observed that there is a visible trend among the values. That is, the trend can be observed with increasing value. This increasing trend can be said due to the increase in the number of orders on coming dates. Now, let us perform a quarterly analysis of the above trend.
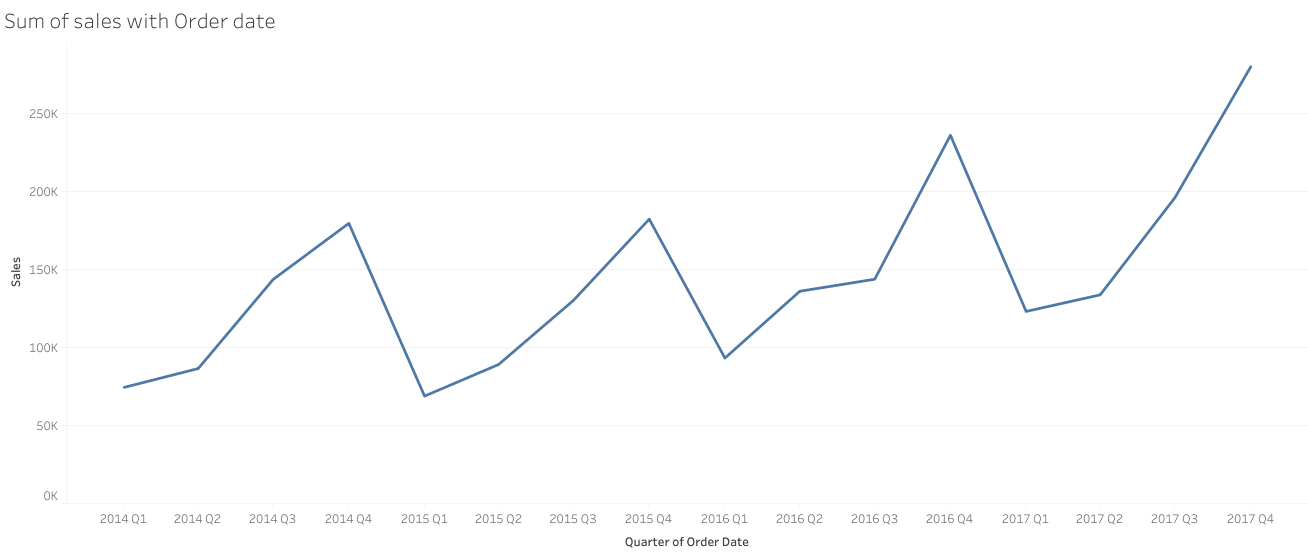
From the above published quarterly data, it can be observed that from 2014 Q1 till the start of 2014 Q4, the sum of sales increases. But this increase observes a downfall in the mid of Q4 of 2014 that was taken forward till the mid of the 2015 Q1. In the mid of 2015 Q1, the sum of sales also starts to increase till the end of Q4 of 2015 but observe a decrease in the start of Q1of 2016. The same increase/decrease trend was also observed in the quarters of 2016. In the quarters of 2017, the increasing trend had been observed till the end of the year.
For making predictions for the coming year, the trend lines were added to the available quarterly data for determining the p values and the value of R2 for the forecast.
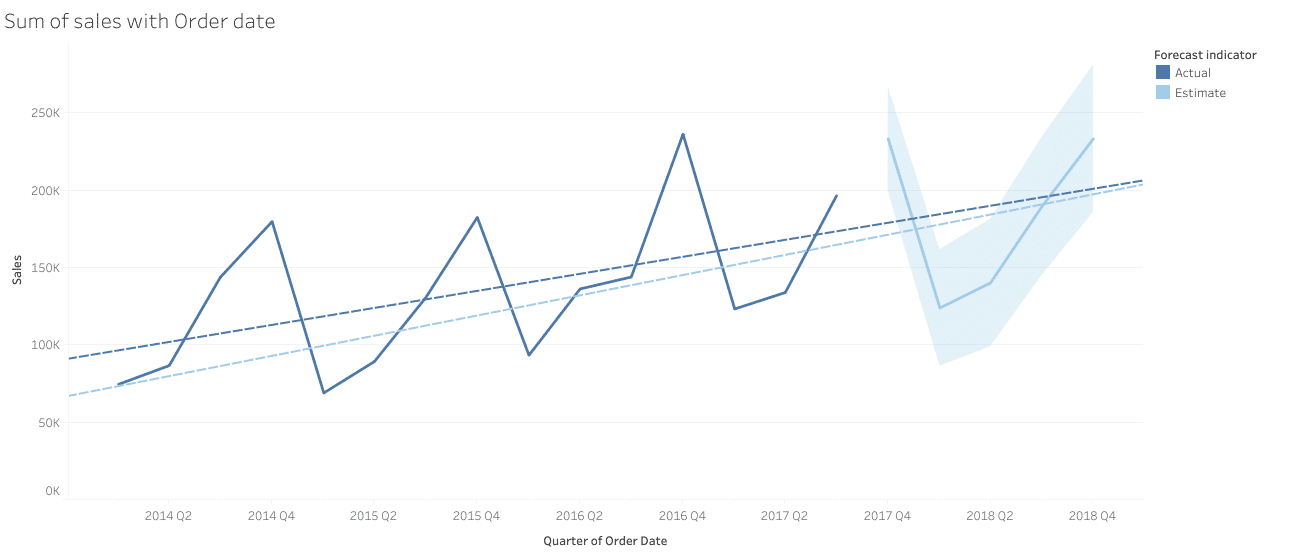
From the above figure, it can be explained that the developed trend line from the data is positively sloped. Same can be said for the estimated line as it is also raising with an increase in the sum of sales. The determined values of R2 and p-value from the actual trend line is 0.2586 and 0.0529, respectively. Whereas, R2 and p-value from the estimated trend line are 0.0407 and 0.7448.
Assess prediction performance
- What percentage contribution have seasonality and trend made to this forecast? What is the quality of this forecast, and what is the projected change of the sum of sales between Q4 of 2017 and Q4 in 2018?
- What is the root mean square error (RMSE) for this forecast? Supposing two other forecasts have been performed using the same data, with root mean square errors of 19.2 and 18.5, respectively. Which of the three forecasts would be the one I would identify as the most reliable, and why?
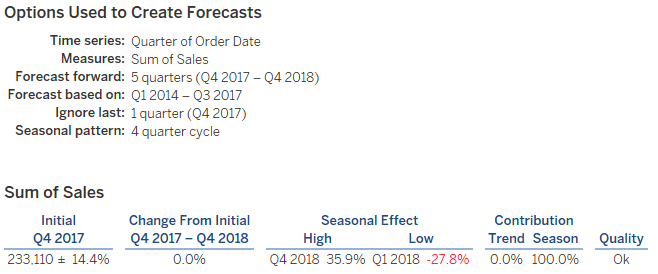
From the table developed for quarterly data about the sum of sales, the summary was developed for the options used in creating the forecasts. From the above figure, the percentage contribution has seasonality and trend made to this forecast are 100% and 0% respectively. The quality of the forecast is mentioned as “OK”. The projected change in the quarter sales of year Q4 2017 and Q4 2018 is 0.0%.
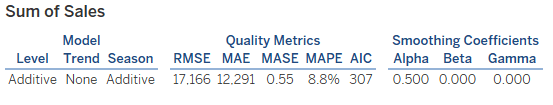
As described from the above Tableau table that had been developed from the quarterly data, the calculated root mean square error (RMSE) value is 17.166. Further, the other two forecasts, when performed, came up with the RMSE value of 19.2 and 18.5, respectively. Now, the decision making with respect of determined values of RMSE, it can be elaborated that the predicted values of the collected data display medium level of dispersion from the developed trend line in the graph of quarterly data of Superstore sales and date of order data.
The most reliable test of RMSE from the previously calculated values can be described as RMSE at 19.2 because such type value is much relevant for recording the level of dispersion in the actual data as the collected data is around 10,000 entries. And, the determined level of dispersion through RMSE of 17.166 is very much minimal. Even though the selected value of RMSE is 19.2, which is much less than in the comparison of worked data, but it is more than the determined value of RMSE of 17.166.