Product Managers use software development metrics to plan and control the software development process and make decisions about process changes measuring the right things.
I divide software development metrics into two types:
Agile process metrics to assess a software development project’s health and the productivity of the teams involved:
For agile and lean processes, the basic metrics are lead time, cycle time, team velocity, and open/close rates. These metrics aid planning and inform decisions about process improvement. While they don’t measure success or value-added, and they have nothing to do with the objective quality of the software.
Leadtime—how long it takes you to go from idea to delivered software. If you want to be more responsive to your customers, work to reduce your lead time, typically by simplifying decision-making and reducing wait time. Leadtime includes cycle time.
Cycle time—how long it takes you to make a change to your software system and deliver that change into production.
Team velocity—how many “units” of software the team typically completes in an iteration (a.k.a. “sprint”). This number should only be used to plan iterations. Comparing team velocities is nonsense because the metric is based on non-objective estimates. Treating velocity as a success measure is inappropriate, and making a specific velocity into a goal distorts its value for estimation and planning.
Open/close rates—how many production issues are reported and closed within a specific time period. The general trend matters more than the specific numbers.
Software metrics to measure software quality over time.
Code quality
The code quality metrics assess your software health through automated code reviews. Low KPI values for code quality mean that code is too complex and likely to pose difficulties with extending functionality and running support activities.
The main code quality metrics are:
Maintainability index
Cyclomatic complexity
Depth of inheritance
Class coupling
Lines of code
Tools like Microsoft Visual Studio automatically calculate these
Performance indicators
Testing quality
The testing quality KPIs demonstrate the maturity and production readiness of software. It also states a QA team’s productivity in minimizing software bugs and contributing to high-quality software releases.
Test coverage
Test coverage shows the percentage of software requirements covered with test cases. Maintaining test coverage high improves the compliance of software with the requirements specification.
Defects found during user acceptance testing (UAT)
Defects found during UAT reflect the level of software quality before production. If the number of bugs discovered during UAT is close to the number of bugs found before it, both testing and software engineering stages may need improvements.
Defects found in production.
The bugs that slipped into production can cause revenue loss as they turn down users from using the software. Thus, you should ensure that at least 90% of bugs are eliminated before software release.
Solution availability
Solution availability is an important KPI group as users may abandon an application that is problematic to access and use. It also shows a software development team’s efficiency in troubleshooting and improving application performance.
Meantime between failures (MTBF)
MTBF can be used for predicting software failures and evaluating the work of a support team. Low metric values here can indicate insufficient system performance monitoring or a poorly executed repair job in the past.
Meantime to recovery/repair (MTTR)
MTTR shows how much time the team usually spends fixing software issues. The repair time covers only an active restoring period, testing and returning to functionality. As for the recovery time, it starts from the initial issue detection and analysis and proceeds to repair. The difference especially matters in outsourced software development projects while negotiating a Service Level Agreement – both parties should acknowledge what exactly they are measuring.
Keeping MTTR at the lowest is critical in a software development project to avoid long downtimes and consequential revenue loss.
Number of unavailability cases
The metric indicates how many times a month, an application failed and helps analyze the evolution of the solution’s availability. However, we shouldn’t aim at achieving precisely 100% uptime as some downtime may be required for scheduled application maintenance.
Page load time (only for web apps)
Page load time shows how quickly the content loads on a web page. This metric should be improved continuously as it strongly affects the overall user experience. Your web app should stay within 2-3 seconds of the page load limit (lower is even better). Otherwise, users may leave it. Also, search engines are likely to rank slow pages lower in search results.
Solution security
Security metrics are used to plan vulnerability management activities. Here, the value numbers matter not as much as a general trend revealed by comparing them over the course of a software development project.
Number of vulnerabilities found by regular penetration testing
This metric shows the degree of solution exposure to security risks.
Ideally, the values of this KPI should decrease with the project progress, indicating that the solution matures in terms of security. Increasing numbers may mean that software updates are deployed into production in a rush.
Number of known vulnerabilities unresolved
The number of patched vulnerabilities doesn’t give a full picture of your solution’s security posture if not compared to the number of security loopholes still left open. Measuring this KPI helps keep these loopholes insight and plan timely actions on security improvement.
Number and severity of security incidents
This metric states the general trend in solution security and helps prioritize the incidents that should be attended to in the first place. The criterion behind the severity ranking is based on how strongly an incident can affect software reliability.
User satisfaction
User satisfaction is measured through surveys. Offering users to rate their experience helps understand what is good in the application and what can be enhanced in the next iteration. You can include the following parameters to your user satisfaction surveys:
Meeting user expectations on functionality.
User interface convenience.
Stability of software performance.
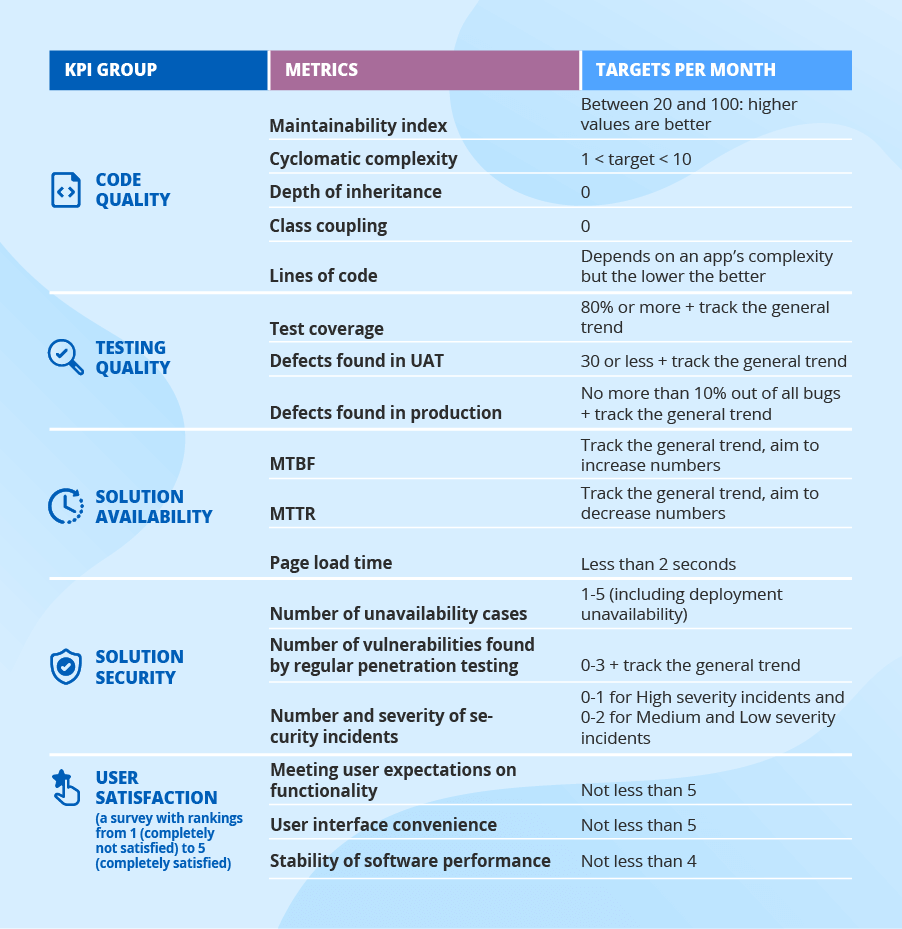
KPI target examples
Share on linkedin LinkedIn Share on whatsapp WhatsApp Share on twitter Twitter Share on facebook Facebook Share on pinterest Pinterest